

One thing almost every single layman knows about trading is that it involves a lot of charts. That is definitely true. However, unlike a layman, a trader will have to know how to analyze the charts and recognize certain patterns. Those patterns can be used to then maximize the potential of said trader’s gains. So, this time, we will be talking about the triple tops and triple bottoms patterns.
Triple tops and bottoms
These two patterns are reversal patterns. Reversals, or corrections, are, simply put, a price direction changes against current trends. They can be both positive and negative. Usually they appear when traders try to change the value of an asset past the levels of support or resistance. They would attempt to do so, of course, in the direction of the prevailing trend.
So, when the market tries to move a security in its trending direction and fails this pattern might emerge. Usually, after three attempts that did not work out, the traders give up.
Triple top

The triple top is a bearish reversal pattern, meaning that a downward trend follows it. The triple top is created when an asset that is already on an upwards trending path hits the resistance line three times without a breakout. In this scenario, the security will attempt to breach the resistance level and fall to the support area. Once it falls three times, this pattern ends, and with it, the stock plummets through the support. From there, it will usually continue the dropping trend. The actual first step in the triple top pattern is the creation of the new peak. This peak is slowed down by the selling pressure which defines the resistance level. The selling pressure will then cause a downward movement until the stock finds the buyers who move back into it. This is the support level. Now, as the price goes up those who came back into it will sell bringing the stock back down.
Usually, this will happen three times. At that point, the buyers, who have failed to increase the value three times, will give up. This means that the sellers take over the securities value. Since there is no longer a line of support it will trend down.
As it is, this pattern is not easy to notice in time as it can resemble several other patterns. However, what is important with it is to wait for the price to breach the resistance before buying. Once you can confirm this pattern, you will want to calculate the price objective. It usually does so by deducting the distance between resistance and support from the breakout point.
Triple Bottom
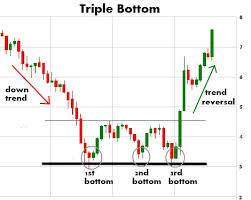
This is the opposite version of the triple top. Unlike the bearish triple top pattern, the triple bottom is a bullish one. This means that it will end up with an increase in value. Essentially, the triple bottom pattern is a signal of a reversal of a sinking trend.
Essentially, a triple bottom pattern shows an asset that is trending downwards but fails to go through support three times. Each time it fails, it goes back up to the level of resistance. Once the third try fails, the asset will break the resistance level and go up. Essentially, it functions exactly like the triple top pattern, except that the roles are reversed. This time the buyers are going against the trend and move the security up.
The importance of these patterns
These two patterns offer significant insight into the stock movement. We can see an ongoing trend finding itself in boundaries of support and resistance. This usually stops its ability to go on. It indicates that trading pressure that was helping the trend is growing weak. This also indicates that the opposing pressure is strengthening.


