A stock chart is a graphical illustration of stock market data and its qualitative analytical data. They are often used to ease the understanding of large quantities of data and the relationships between them.
There are several types of stock charts that are used to gauge the price movement of the stock over time.
Line Charts
 A line chart is the simplest type of chart as it represents only the closing prices over a set time frame. A line chart is created by connecting the closing prices for each period over the time frame. When strung together with a line, a line chart reveals the general price movement of a share over a period of time. However, line charts do not provide much insight into intraday price movements such as high, low , or open prices. Line charts usually feature the stock price or trading volume information on the vertical axis and the equivalent time period on the horizontal axis. A line chart is considered to be a useful tool as it highlights only the closing price which is treated as the most important price among the four. Overall, unlike other stock charts, the line chart make sit easier to spot trends because there is less ‘noise’ happening.
Bar Charts
Also known as open-high-low-close (OHLC) charts, bar charts are the most basic tool of technical analysis. Bar charts make use of vertical lines which signify the highest and the lowest price the stock traded at during a day. The horizontal line extending to the left signifies the opening price and the short horizontal one extending to the right signifies the price at which it closed the trading day. The color of the bar is based on the net gain (green) or loss (red) on the closing price. The major advantage of a bar chart compared to line chart is that its more informative and reflects prices and price volatility. When compared to candlestick bars which illustrate emotions, bar charts visualize price range easier.
Candlestick Charts
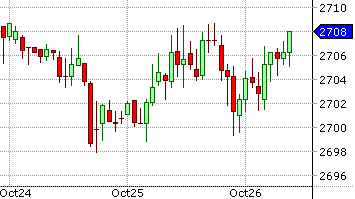
 The candlestick chart resembles a bar chart only that it varies in terms of visual representation. The candlestick offers the same information as a bar chart but in a more advanced and better way. The candlestick comprises of three parts: the body, the upper tail and lower tail. The body comprises of the opening price and closing price for a particular time period. A green body suggests that the closing price was higher than the opening price, which is considered bullish since the net result is price rise. On the other hand , a red candle means that the closing price is lower than the the opening price. The line at the upper end of a candlestick signifies the day;s highest trading price while the line at the lower end of the candlestick signifies the day’s lowest trading price. Generally, a candlestick chart is considered to be better than bar chart as it indicates trend continuation and trend reversal more clearly and more precisely.
Point and figure charts
These charts are not very popular among average investors, but they were widely used by the first technical traders. Point and figure charts reflect price movements without time or volume concerns hence helping to filter out insignificant price movements that can distort a trader’s view of the overall trend. The charts comprise of X’s and O’s which represent net price changes. The X column represents rising prices while the O column represents falling prices. Furthermore, this type of charts also try to eliminate the skewing effect that time has on chart analysis. Unlike other types of stock charts, point and figure charts do not use the time input on a linear basis.
Stock charts are the most fundamental aspect of technical analysis. Therefore, it imperative for stock traders to correctly interpret various types of stock charts.


