
Analyzing charts is a big part of a trader’s world. In fact, that is something almost everyone knows. The first thing a layman will think about when he sees the word “stock” is a pile of charts. And analyzing the patterns you can see on the chart will help you greatly when you set out to trade.
The Cup and Handle Pattern
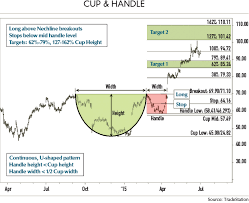
This specific pattern is named after the shape it takes. Namely, if you draw a line under the pattern it will look like a cup with a handle pointing to the right. Now, to explain in actual financial terms. Simply put, this pattern means that an upward movement stopped and went on a decline, but will regain the rise after the pattern completes. This pattern can take a year, but will, in general, maintain its form.
This chart pattern usually follows an upward trend, which then slows down. As it slows down a lot of people will start selling off. The sell-off will drop the price down and then, the asset should trade flat for a while. However, afterward, the value should go back to the original peak. This is the cup part. The handle, or the last part of this chart pattern, is a lot smaller drop caused by the increase of price and selling. Right after that, it just continues on its bullish path.
Component #1: The Upward Trend
To confirm this pattern there are multiple components that need to happen in order to be a valid signal for trading. First of all, there has to be a stable rising trend before the cup starts forming. The bigger the trend was, the breakout is less likely to happen after the pattern completes. The more time the run-up to the pattern in the asset has to build the less potential the upward move has.
Component #2: The Cup
The shape of the cup is very important. To follow the pattern, it should be a rounded formation. After all, the shape forms when some of the investors choose to leave the asset while others keep it while expecting the rise. If the shape of the cup is more of a letter “V” it might not be the correct signal.
You should also focus on the height of the cup. Traditionally, this pattern should fall somewhere between 30 and 60 percent of the previous trend.
Component #3: The Handle
The handle is the component that ends the pattern. That is why it is very important. Once the cup forms and the asset is on the rise again, another, smaller sell-off should happen. As a rule of thumb, the handle should not drop more than a third of what the cup did. So, on the right-hand side of the chart, there should be a smaller drop. The breakout signal is formed once a descending trendline appears. And a move by the asset that is above the trendline in question is a signal that the upward trend is about to continue.

Look For Volume
An important factor in most patterns is the volume. You cannot truly confirm the existence of the pattern or the signal without enough volume. Focus on the breakout and follow the volume. The more volume there is during the breakout the more certain it is for the trend to go on.
The use of this pattern is tried and tested on the market. Of course, there are no absolutes and the signals can be misinterpreted. But, a lot of investors have managed to create a profit by recognizing this pattern.


